Changelog
We ship continuously to make ecosystem tracking clearer, faster, and more reliable. Here’s a timeline of what’s changed.
Analytics
Performance
Infrastructure
Ecosystem Performance Overview
We’ve introduced a new ecosystem-level performance model that gives teams a clearer view of how revenue, cost, and growth signals interact in real time.
This update improves how Finora aggregates metrics across products, making it easier to understand where value is created and where optimization is needed.
Highlights
Improved aggregation of revenue and profit signals
Faster metric recalculation across dashboards
More consistent data updates across devices

Design
Visualization
UX
Advanced Signal Visualization
We’ve refined how complex ecosystem data is visualized, introducing clearer hierarchy and smoother transitions between data layers.
These changes make it easier to spot trends, compare segments, and interpret growth signals without losing context.
Highlights
Improved visual clarity for multi-layer charts
Better contrast for active and inactive signals
Smoother animations during data updates
Analytics
Insights
Growth
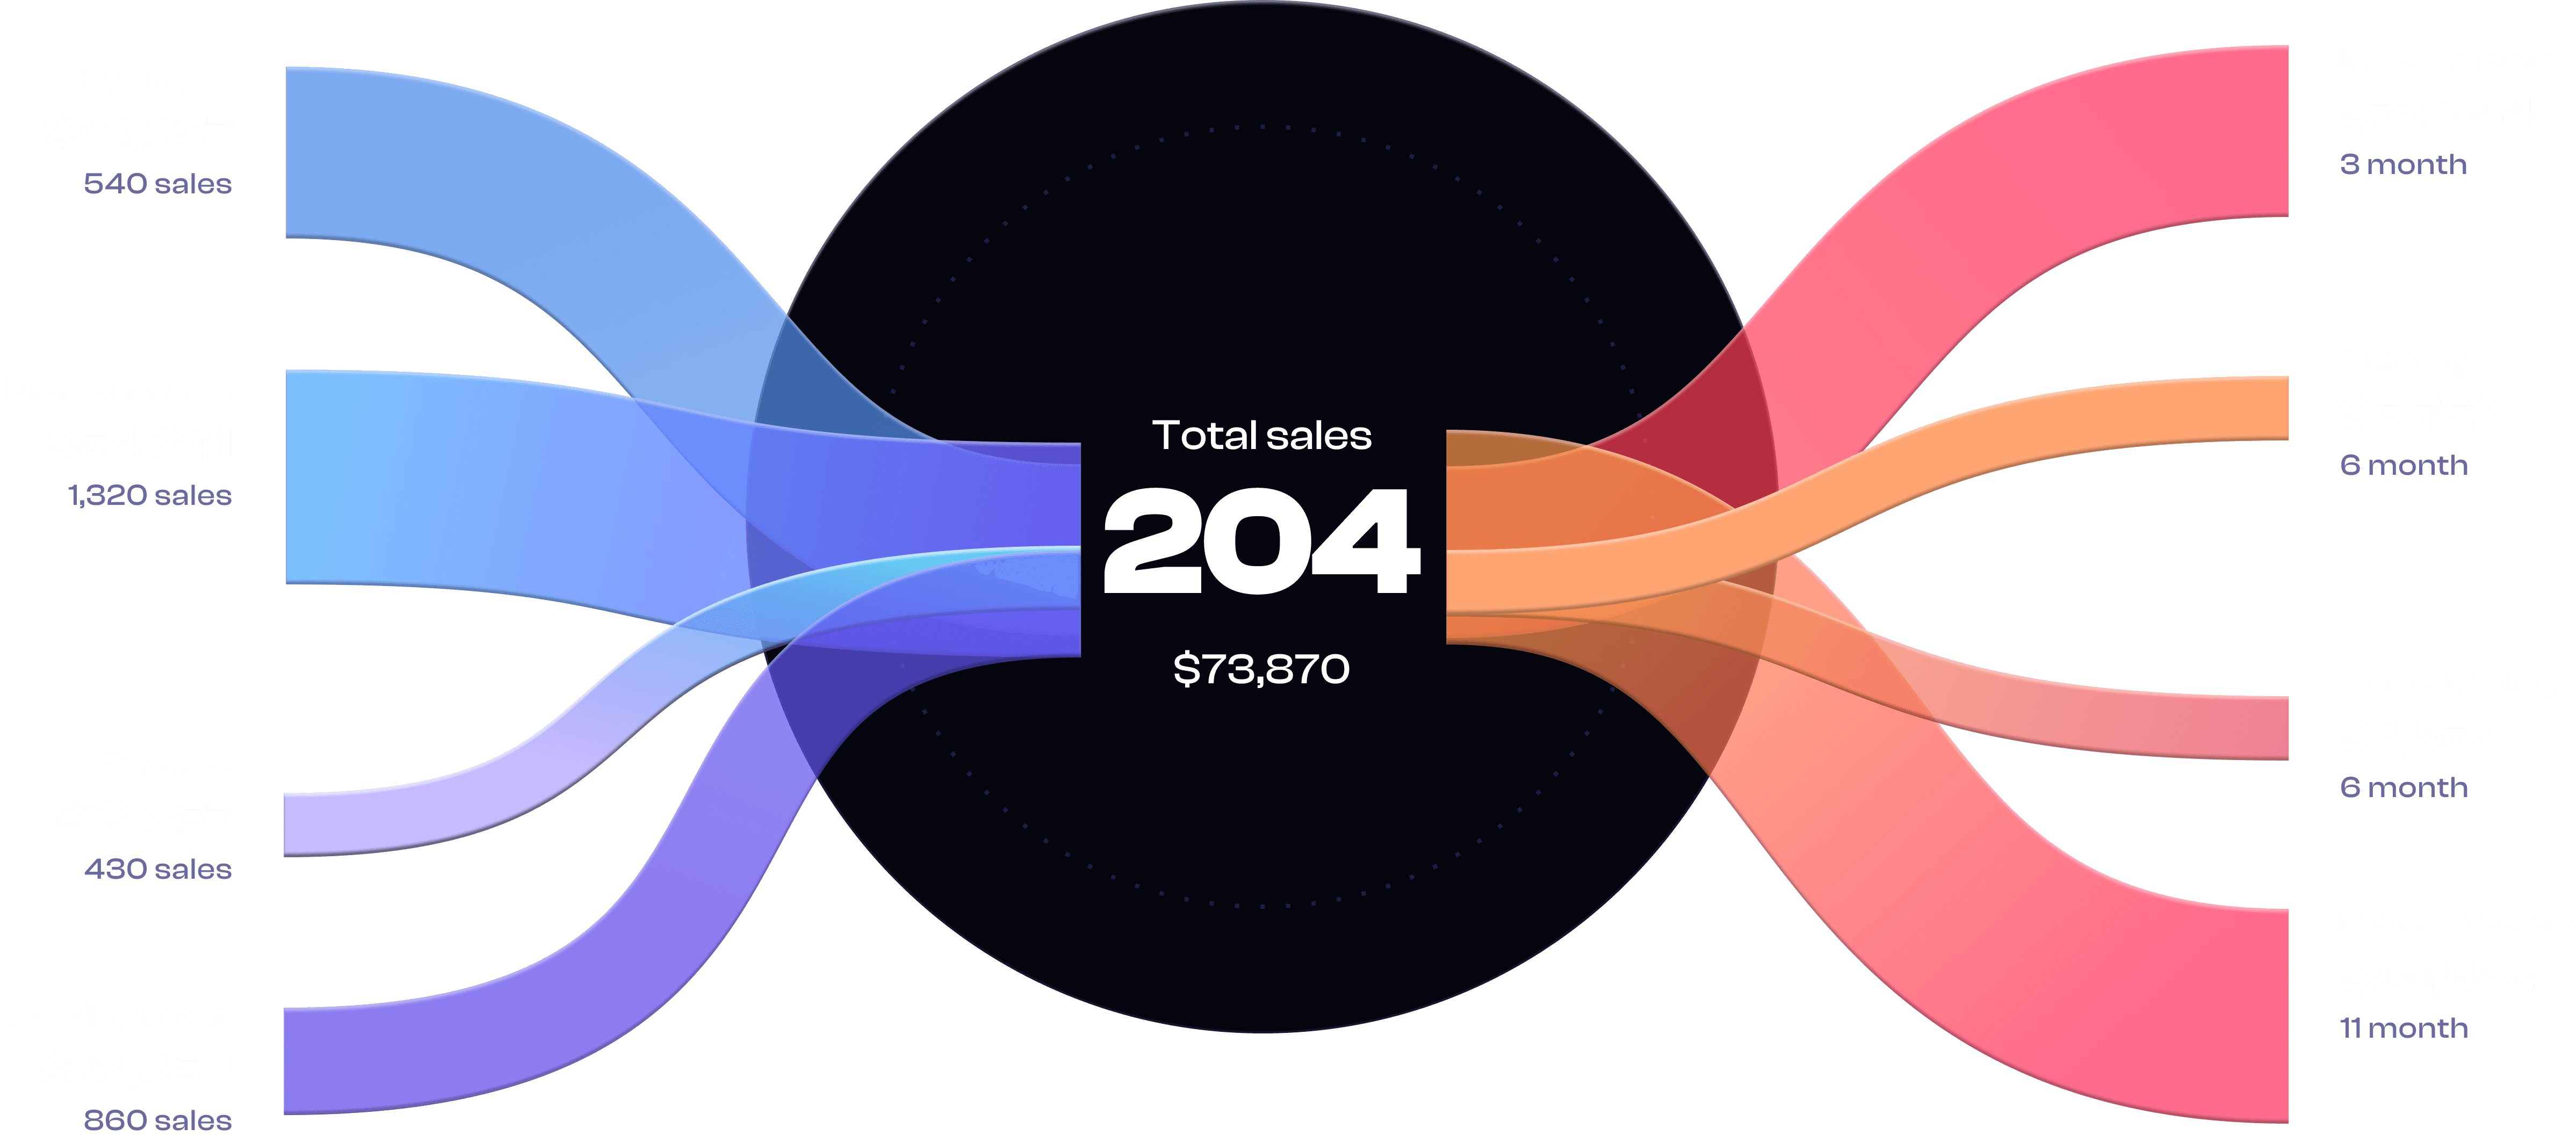
Revenue Flow Mapping
Finora now provides deeper insight into how revenue flows through your ecosystem - from source to outcome.
This update helps teams identify which inputs drive the most impact and which areas need attention.
Highlights
Clearer breakdown of revenue sources
Improved attribution for growth drivers
Enhanced comparison between periods
Performance
Stability
Backend
System Reliability Improvements
We’ve made behind-the-scenes improvements to ensure Finora remains stable and responsive as your ecosystem grows.
These updates focus on performance under load and long-term reliability.
Highlights
Faster dashboard load times
Improved handling of large data sets
Reduced sync delays across regions
